Emissions calculator
Use the emissions calculator below to explore how emissions you generate when you travel in cars, buses, or even motorcycles!
Once you've entered the details into the form, graphs will be generated to show you how it all compares.
Do you know how vehicle engine types compare?
Find out the pros and cons of Petrol vs Diesel vs Hybrid vs Electric engines »
... and get some tips to increase fuel efficiency!
How do we calculate emissions?
The aim of this calculator is to determine the amounts of fine particulate matter (PM10), oxides of nitrogen (NOx) and carbon dioxide (CO2) that are released in to the atmosphere by all of your journeys to and from school within a year.
To calculate the pollution released during your journeys to and from school, we need certain information.
We need to know:
- The distance of the journey (in miles)
- The number of journeys to and from school within a year
- The number of passengers in the vehicle
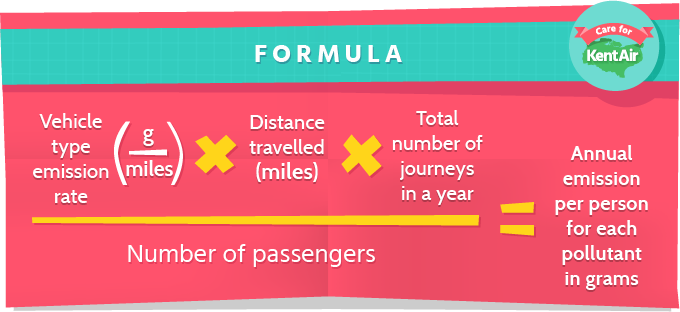
We also need to know the vehicle emission factor which gives the specific emissions, in grams of pollutants per mile, for different types of vehicles. We use vehicle emissions factors that are based on current understanding of likely emissions from vehicles in Kent. This vehicle emission factor is then used to convert activity data (e.g. distance travelled) into pollutant emission rates (e.g. grams of PM10 emitted per mile travelled for different vehicle types).
The emission rate is then multiplied by the number of journeys to and from school that are made within a year (we’ve assumed you go to school 190 days per year). Everything is then divided by the number of passengers in the vehicles so that we know annual emissions per person for each pollutant.
Assumptions made in the calculator
Calculating vehicle pollutant emissions can be very complicated. For this reason, the following assumptions are made in order to simplify the calculation:
- Emission rates are based on the current understanding of the likely vehicle fleet age mix in 2015 in Kent
- The typical school year is assumed to be 190 days
- The average speed is 30 mph in an urban area
- Buses are assumed to be double-decker holding 60 passengers